Patients who fail to attend scheduled appointments without prior notification to their healthcare centres, i.e. “no-shows,” create negative outcomes for both healthcare providers and patients. This study examined whether visible-minority status, ethnicity, country of origin, immigrants’ age at arrival, and immigrants’ length of residency in Canada were related to no-show behaviours using data from 2,238 participants from four selected months—January, April, July, and October, 2012—at a community health centre in northwest Toronto, located in a highly diverse community in which 53.9% of the clients were visible minorities. The study examined two forms of no-show behaviour: number of appointments missed and percentages of appointments missed. The results suggested a relationship between the number of appointments missed with visible-minority status, ethnicity, and country of origin. A relationship was also found between percentage of appointments missed with country of origin, immigrants’ age at arrival, length of residency in Canada, and immigrants’ visible-minority status. Immigrants who had been in Canada fewer years and who arrived at a younger age showed the highest rate of no-shows. Visible-minority immigrants had a higher percentage of no-shows, though how significant this finding was depended on age at arrival. However, when both immigrants and non-immigrants were considered, the highest no-show rate came from non-immigrants who were not visible minorities. Further study should investigate reasons for no-shows using factors identified by the current study. Some recommendations for the Centre are also presented.
Keywords: no-show, visible minority, ethnicity, country of origin, appointment, immigrant, age
Patients who miss scheduled appointments without notifying their healthcare providers, or “no-shows,” cause various issues for their healthcare centres, for other patients, and for themselves. Missed appointment slots by no-shows create loss of revenue and time for healthcare centres (Satinani, Miller, & Patel, 2009), inconvenience to other patients who are on waiting lists, and potential health risks to the patients themselves because of missed treatments (Dave & Barragan, 2012; Defife, Conklin, Smith, & Poole, 2010; Paterson, Charlton, & Richard, 2010). No-show rates range from 9% to 50% and problems caused by no-shows are serious (Paul & Hanna, 1997; Peeters & Bayer, 1999). Therefore, it is important to identify reasons and factors contributing to no-show behaviour and to develop effective interventions to reduce no-show rates.
Reasons for no-show behaviour are varied and complex. Some reasons are due to personal problems such as medical issues, life conflicts, lost motivation (Defife et al., 2010), lack of transportation, no phones to call, and simple forgetfulness (Bean & Talaga, 1995; Campbell, Chez, Queen, Barcelo, & Patron, 2000; Maxwell et al., 2001; Paul & Hanna, 1997). Some may have problems with their clinics, such as trust issues, feelings of discrimination, and a misunderstanding of the appointment system (Lacy, Paulman, Reuter, & Lovejoy, 2004). Other reasons include demographic factors such as age, gender, race, education, and language barriers (Finkelstein, Liu, Jani, Rosenthal, & Poghosyan, 2013; Martin, Shi, & Ward, 2009; Mitchell & Selmes, 2007; Parikh et al., 2010).
The current study explored the no-show phenomenon in order to reduce no-show rates at the Black Creek Community Health Centre (BCCHC), a community health clinic in Toronto, Canada. The BCCHC offers various clinical services and programs to its community. They have implemented reminder calls to reduce their no-show rates; however, nearly 30% of the total appointments remain “no-shows” (Dave & Barragan, 2012). The goal of this study is to find factors and/or characteristics of no-shows at the Centre and, ultimately, to develop alternative interventions to reduce no-show rates.
The research on no-shows at the BCCHC originally started as a team project for the Advanced Community-Based Applied Research course 2012-2013 at York University. Each member of the team looked at the no-show phenomenon from different perspectives and examined unique factors. My study originally focused on the relationship between no-show behaviour and language discordance between patients and healthcare providers at the BCCHC. The study revealed an outcome opposite to the hypothesis: English speakers in fact had more no-shows; thus, other factors needed to be examined (Fukuoka, 2012). I then continued research on the no-show phenomenon at the BCCHC as an independent study, supervised by Dr. Michaela Hynie, York University, and investigated different factors. The present contribution discusses unique characteristics of the community served by the BCCHC and explores possible relationships between these characteristics and the no-show phenomenon.
One of the unique characteristics of the BCCHC is its diversity of population. The Centre is located in the Black Creek neighbourhood in northwest Toronto. The majority (70.6%) of the residents in Black Creek are visible minorities (City of Toronto, 2013a), whereas 47% of residents in the City of Toronto are visible minorities (Statistics Canada, 2013). The percentage of immigrants in Black Creek is also higher than that of Toronto in general: 63.0% and 50.1%, respectively (Wilson et al., 2011). These numbers show that the community served by the BCCHC is more diverse than the City of Toronto as a whole, one of the most diverse cities in the world (City of Toronto, 2013b).
In the Black Creek neighbourhood, many ethnic minority groups have faced multiple discriminations (Access Alliance, 2011). The target factors of discrimination included language, religion, immigration status, the area of Black Creek, race, age, gender, education outside Canada, and limited English proficiency (Access Alliance, 2011). A study reported that perceived discrimination was positively related to a person’s own racial identity (Heim, Hunter, & Jones, 2011). Perceived discrimination also has an association with negative feelings towards the healthcare system, professionals working within it, and the use of healthcare services (Harris et al., 2012). These negative feelings include trust issues. Uslaner (2012) mentioned that visible minorities are less trustful of the system than non-visible minorities because of perceived societal discrimination. It is also important to note that “perceived disrespect of the patients’ beliefs and time by the health care system” was mentioned as another reason for no-shows (Lacy et al., 2004, p. 542). Feelings of distrust toward society could then influence a person’s no-show behaviour.
However, immigrants would be able to develop feelings of trust toward society if they could integrate and establish a strong national identity (Uslaner, 2012). These feelings of belonging to the nation could help prevent perceived discrimination, which might contribute to trust toward society and/or the healthcare system. That is, attachment to their ethnic groups would weaken over time, causing a stronger connection with their adopted nation (Wu, Hou, & Schimmele, 2011). Therefore, the length of residency seemed to be an important factor in a sense of belonging to the nation.
Furthermore, a Canadian study revealed that the age at which immigrants arrive in Canada was also a predictor of national belonging (Cheung, Chudek, & Heine, 2011). If individuals arrived before 14.5 years of age, the length of time in Canada and adaptation to the country were positively related at a significant level, yet the effect changed if individuals immigrated after 14.5 years of age (Cheung et al., 2011). The relation between age at immigration and length of residency in Canada actually yielded a moderately negative result, typically, in terms of identification with mainstream Canadian culture for those who immigrated at around 25 years or older. The authors of the study further reported that, “though none of our participants arrived in Canada after the age of 50, linear extrapolation from our model suggested that the rate of acculturation would have become significantly negative at age 51” (Cheung et al., 2011, p. 149). One’s age at arrival in Canada, therefore, in addition to one’s length of residency here, is considered to be a crucial factor for national belonging, which relates to feelings of trust in the healthcare system (Uslaner, 2012).
Based on the previous research and discussions mentioned in this section, three hypotheses were proposed:
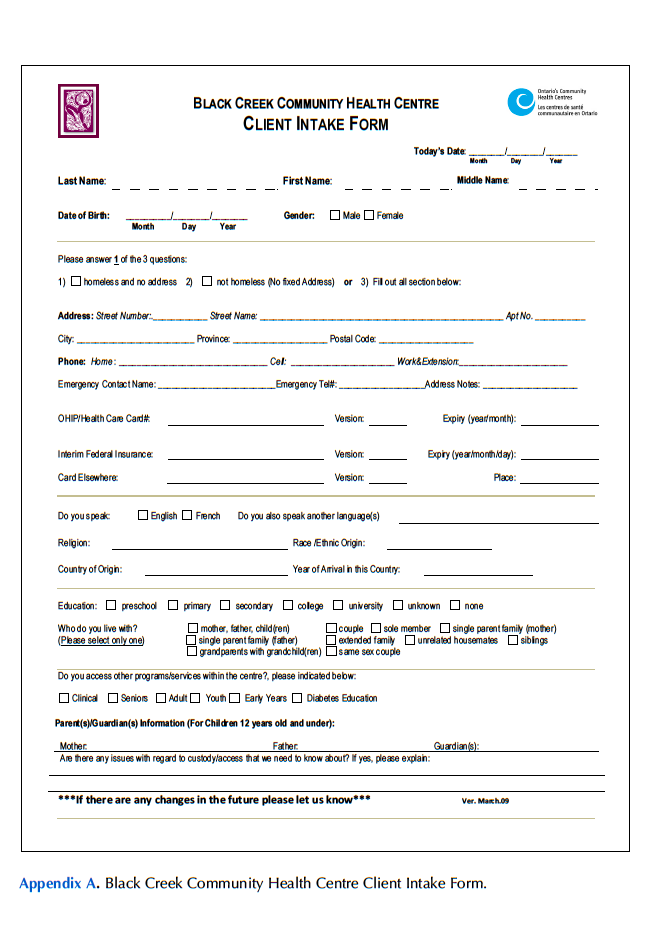
The following data about individual BCCHC clients were obtained from information provided on the Centre’s client intake form (see Appendix A): 1) unique ID; 2) date of intake; 3) gender; 4) date of birth; 5) insurance status; 6) language; 7) race/ethnic origin; 8) country of origin; and 9) year of arrival in Canada. No further personal information was gathered. The analysis was restricted to data taken from clients who were 1) adult patients (18 years and older); 2) patients who made at least one appointment in 2012 from the following clinical services and programs offered by the BCCHC: family doctor, nurse practitioner, registered nurse, foot specialist (chiropodist), nutrition (registered dietitian), counselling services, diabetes education, and breastfeeding support; and 3) patients who had given express permission to the BCCHC to use their information for research and program development.
The records of appointments made in 2012 from the eight types of clinical services and programs mentioned above were obtained. From within the year, four months—January, April, July, and October—were selected to represent each season. The records included the number of appointments that each patient 1) made, 2) attended, and 3) missed with each service. “Missed appointments” in this study refers to patients not only failing to physically attend their appointment, but also failing to notify staff of the cancellation. These were defined as “no-show appointments.” It is important to distinguish non-attendance for an appointment with and without a prior notification of cancellation because the problem is only with the latter.
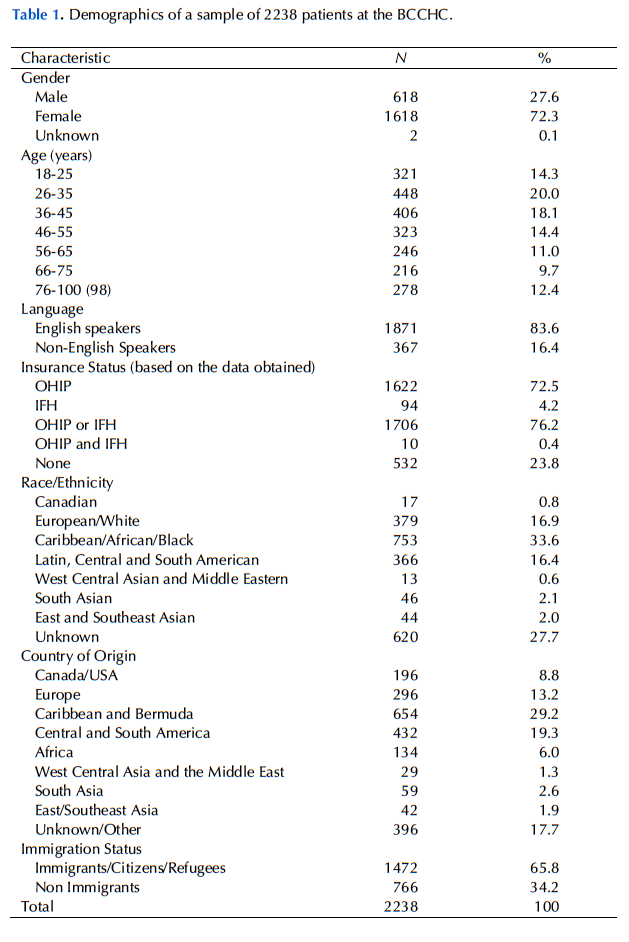
After the selection, the data for 2,238 adult patients at the BCCHC were obtained. The patients consisted of 618 males, 1,618 females, and 2 of unspecified gender. The participants’ age ranged from 18 to 98 years with an average age of 47.38. As for the language, 28 different languages were spoken. Most patients indicated use of the government’s insurance plans but 532 (23.8%) of them did not indicate any plans.
There were 52 different ethnicities and 97 different countries of origin (places of birth) found. Participants’ countries of origin may differ from their ethnicities. Thus, both factors were categorized for analysis. The classification was referred from the definitions on the Statistics Canada website (Statistics Canada, 2012) and modified considering the participants’ data and suggestions from the BCCHC.
The classification of ethnicity in this study is as follows: 1) Canadian; 2) European origins/White; 3) Caribbean/African and Black; 4) Latin, Central, and South American; 5) West Central Asian and Middle Eastern; 6) South Asian; and 7) East and Southeast Asian. Then, the participants’ countries of origin were classified into the following eight groups: 1) Canada and United States; 2) Europe; 3) Caribbean and Bermuda; 4) Central and South America; 5) Africa; 6) West Central Asia and the Middle East; 7) South Asia; and 8) East and Southeast Asia. Nearly two thirds of the participants (1,472, or 65.8%) were born outside Canada. Table 1 in Appendix B shows a summary of the participants’ demographic information.
People who were born outside Canada were either immigrants or refugees. Their “age at arrival” in Canada was calculated by the date of arrival and birth. Please note that in this study, we did not distinguish between the two and classified refugees as immigrants. Regarding the length of residency in Canada, it too was determined using date of their arrival and birth. These calculations were also done for non-immigrants. If participants were born in Canada, the length of residency was identified as their age and age at arrival was, therefore, zero.
Certain ethnic groups were defined as Canada’s visible minorities. According to Statistics Canada (2012), the definition is “persons who are non-Caucasian in race or non-white in colour and who do not report being Aboriginal.” The classification of the visible minorities by Statistics Canada (2012) was: 1) Chinese; 2) South Asian; 3) Black; 4) Filipino; 5) Latin American; 6) Southeast Asian; 7) Arab; 8) West Asian; 9) Korean; and 10) Japanese. In addition, “Oriental” was included in this study based on the participants’ record. The data show that more than half of the participants (1,207, or 53.9%) were visible minorities.
To analyze percentages of no-shows (no-show rates), analysis of variance (ANOVA) and analysis of covariance (ANCOVA) were conducted to examine factors such as ethnicity, country of origin, and visible-minority status. All unknown categories in dependent and/or independent variables (visible-minority status, race/ethnic background, country of origin, and gender) were treated as missing data and excluded from analysis. In addition, patients who indicated their ethnicity as Canadian at intake were also excluded because, given Canada’s multiethnic history and present, and the various and nuanced acceptations of “Canadian,” such a designation did not allow us to draw meaningful conclusions.
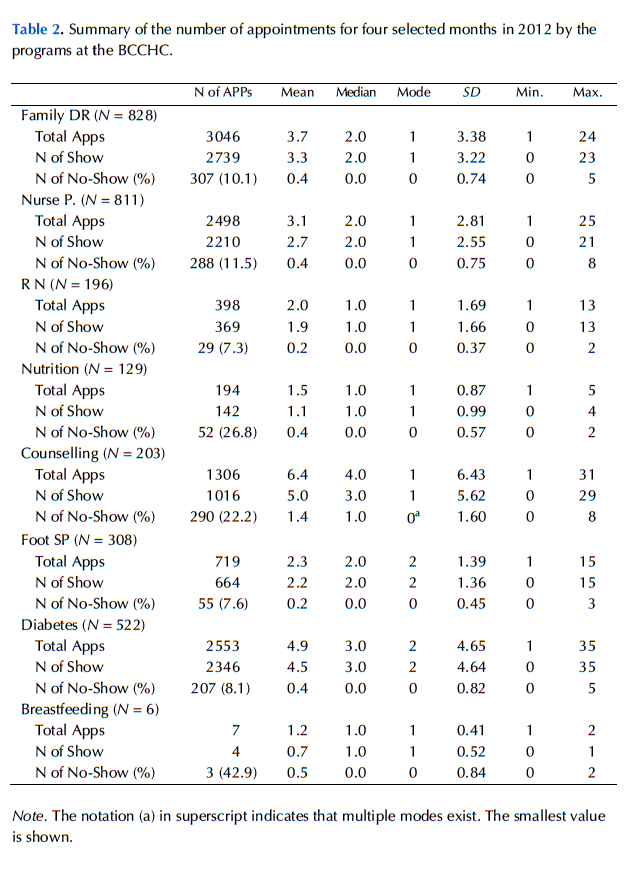
No-show rates were calculated from the total number of no-shows divided by the total number of scheduled appointments from all services and programs. No-show rates for each clinical service/program were not utilized because the numbers of total appointments in some services were relatively low and difficult to analyze (see Table 2 in Appendix B for a summary of information regarding the number of appointments for each service/program).
As past research suggested a negative association between age and no-show rates (Bennett & Baxley, 2009; Parikh et al., 2010), we controlled for age in the analysis. Also, participants who made only one appointment (478, or 21.4% of the total) were excluded when no-show rate was used in the test in order to avoid all- or-nothing cases. For example, if a person only made one appointment during the selected months, showing or not showing once to the appointment made a 100% difference. The same 100% no-show rate means something totally different when it was a person who made, for example, 20 no-shows out of 20 appointments. This kind of all-or-nothing extreme effect should be minimized and controlled.
Chi-square tests were used to examine the proportion of the participants in regard to test factors such as ethnicity. We categorized numbers of no-show appointments into three groups: zero, one, and two times or more (0, 1, 2+). In the chi-square test, those who made only one appointment were included because the test examined the number of no-shows, not the rate.
Regarding immigrants’ age at arrival and length of residency in Canada, ANOVA and ANCOVA were used to test their relation to no-show behaviour. Based on discussions in the previous section, these two factors were categorized into three groups: for age at arrival, 1) 0-15 years; 2) 16-24; and 3) 25 or older; for the length of residency in Canada, 1) 0-4 years (newcomers); 2) 5-14 years; and 3) 15 or more years. We also analyzed visible-minority status with two factors (age at arrival and length of residency in Canada) among immigrants. Those who were visible minorities but born in Canada (non-immigrants) were also compared with non-visible minorities among non-immigrants. Finally, visible-minority and immigration statuses with no-show rates were examined.
This study examined 10,721 scheduled appointments made by 2,238 participants. Of all appointments, 1,231 appointments were no-shows, or 11.48% of the total. These “no-show appointments” were created by 703 clients, or 31.41% of the total participants. The number of no-show appointments ranged from 1 to 12, and the average was 1.75. Among no-shows, the number of appointments made during the study period ranged from 1 to 48, and the average was 7.02. The all-participants’ average no-show rate was 12.72%. After the exclusion of participants who made only one appointment, the total number of participants was 1,760; the total number of scheduled appointments was 10,243, and 1,157 of these appointments (11.30% of the total) were no-shows. The average no-show rate after the exclusion was 11.97%.
Visible-minority status
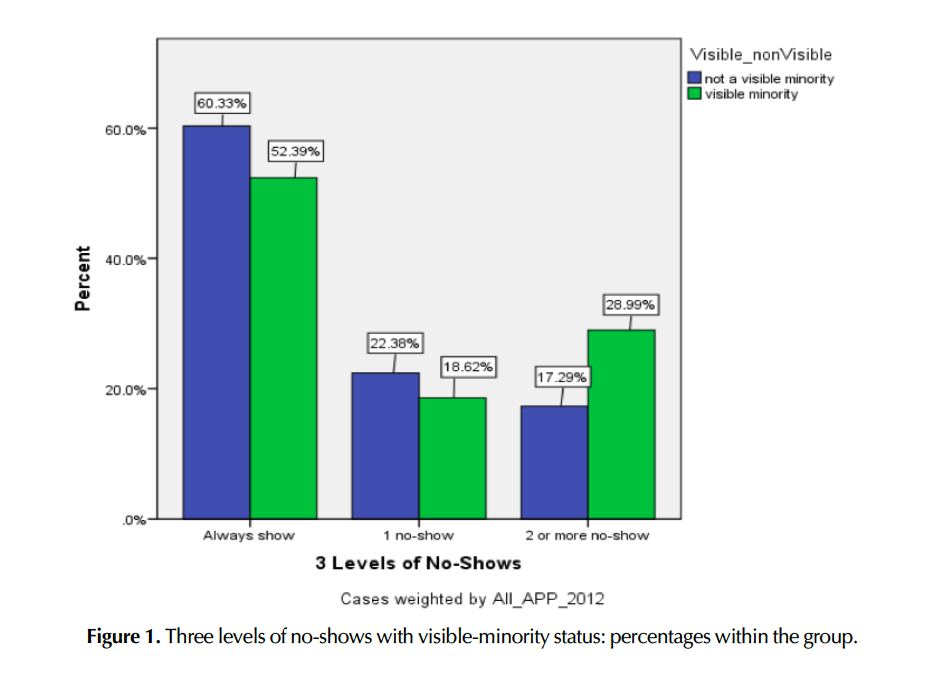
Visible-minority status was examined excluding 620 unknown cases. The total number of participants was 1,618, which consisted of 1,207 visible minorities and 411 non-visible minorities. The chi-square test revealed that there was a notable association between visible-minority status and the three levels (0, 1, and 2 or more) of no-shows, χ² (2, N = 7822) = 93.60, p < .001. v = .109 The tests suggested that visible minorities were more likely to be repeat no-shows. Figure 1 shows differences in percentages between visible-minority statuses.
Race/ethnicity
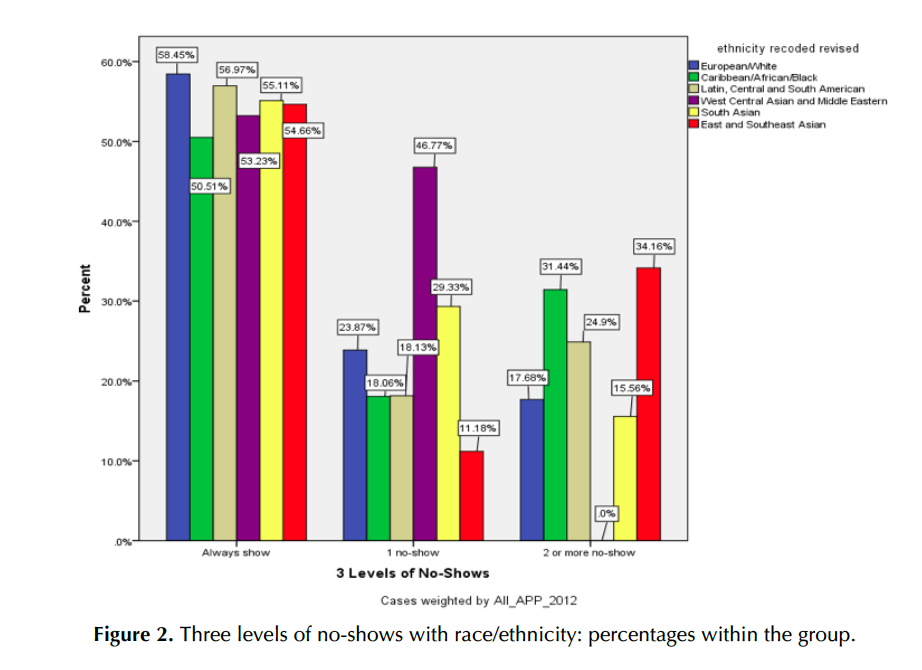
The number of valid cases in race/ethnicity, excluding “unknown” and “Canadian,” was 1,601, which consisted of 379 “European/White,” 753 “Caribbean/African/ Black,” 366 “Latin/Central and South American,” 13 “West Central Asian and Middle Eastern,” 46 “South Asian,” and 44 “East and Southeast Asian.” The chi- square test revealed that there was a significant difference in no-shows among the six ethnic groups, χ² (10, N = 7739) = 192.182, p < .001, v = .111.
In particular, a large difference was found in the one-time no-show category. The groups of “West Central Asian and Middle Eastern” and “South Asian” had significantly higher percentages and numbers than the average and expected numbers compared to the rest. For the two-or-more-no-shows category, “East and Southeast Asian” and “Caribbean/African/Black” showed higher percentages than the average. Figure 2 shows the comparison among six groups in percentages within the ethnicity group.
Country of origin
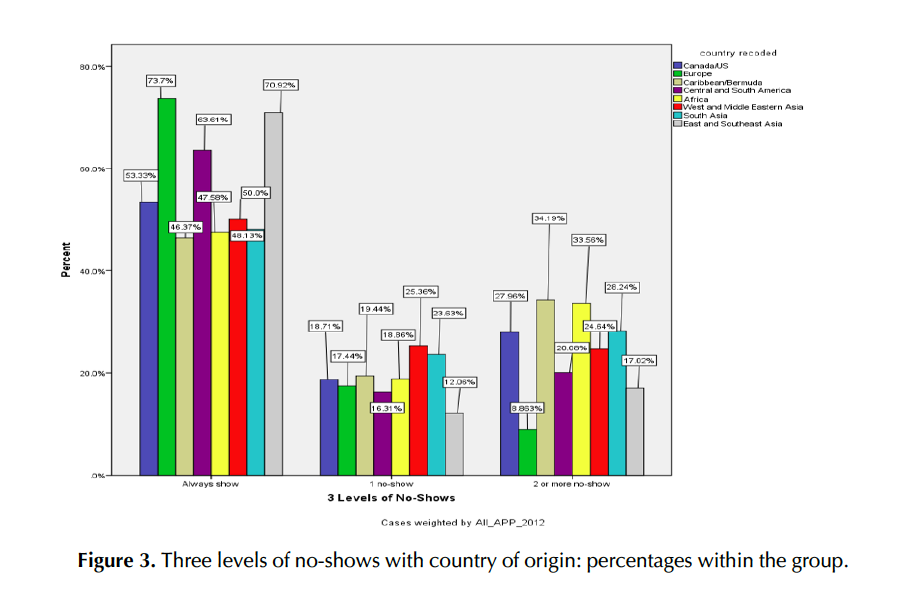
The number of valid cases of country of origin, excluding “unknown,” was 1,842, which consisted of 196 Canada/USA, 296 Europe, 654 Caribbean/Bermuda, 432 Central and South America, 134 Africa, 29 West Central Asia and the Middle East, 59 South Asia, and 42 East and Southeast Asia. The chi-square test revealed that there was a significant association between the eight groups of countries of origin and the number of no-shows, χ² (14, N = 8973) = 431.496, p < .001, v = .155. In the two-or-more no-shows, the “Caribbean/Bermuda” and “Africa” groups showed slightly higher than the average. Figure 3 shows the comparison between groups in percentages within the country-of-origin group.
An ANCOVA was used to examine the means of no-show rates according to participants’ visible-minority status, race/ethnicity, and country of origin. However, there was no significant difference among the no-show rates for each of these factors. While the first and second hypotheses received some support from the chi- square analyses, the ANCOVA analyses did not support them.
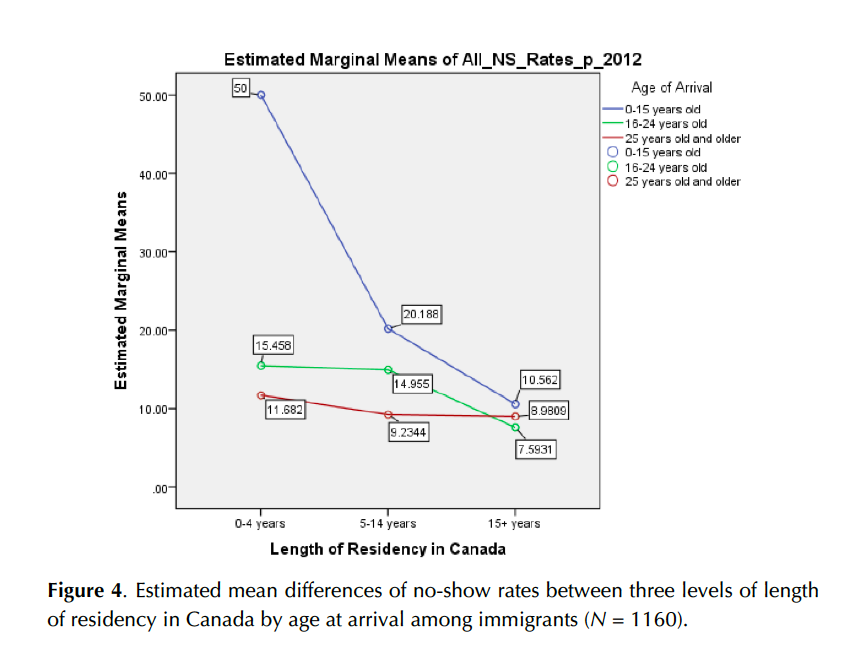
An ANOVA was conducted to explore no-show rates with immigrants’ age at arrival and length of residency in Canada. A total of 1,160 immigrants who made two or more appointments were examined, and a significant interaction among the three levels of age at arrival and the levels of length of residency in Canada, F (4, 1151) = 3.88, p = .004 was found. A significant main effect was also found on age at arrival and the length of residency in Canada, F (2, 1151) = 6.19, p = .002; F (2, 1151) = 11.35, p < .001, respectively.
Length of residency made the largest difference in no-show rates among those who arrived at a younger age (0-15 years old). The longer these immigrants lived in Canada, the lower the no-show rate became; however, this trend did not apply for those who arrived at 25 and older. The third hypothesis was supported (see Figure 4).
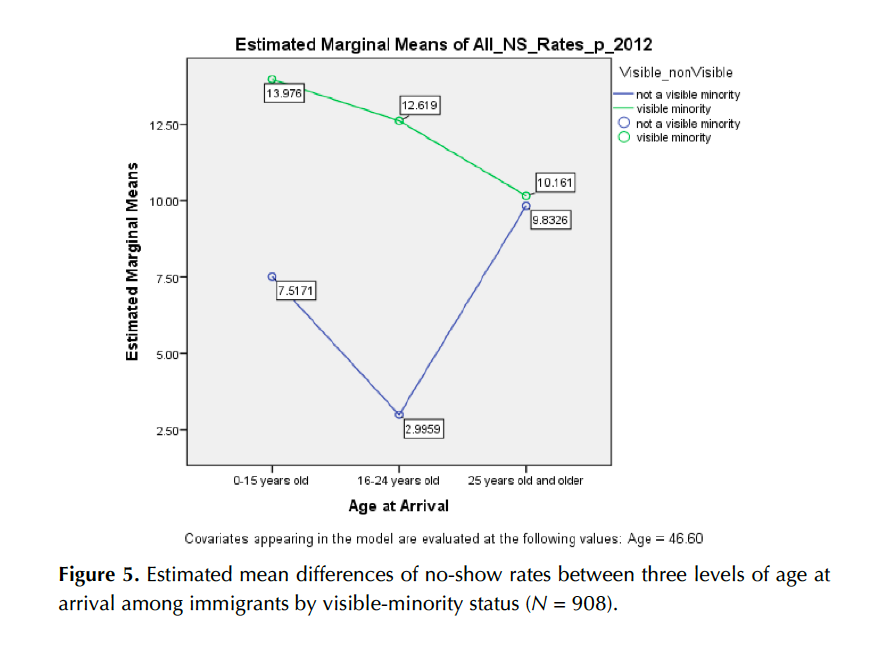
The no-show rates of immigrants with visible-minority status by three levels of age at arrival in Canada were examined using an ANCOVA. A total of 908 cases, 760 visible minorities and 148 non-visible minorities, were examined. There was a significant interaction between age at arrival and visible-minority status in no-show rates, F (2, 901) = 3.49, p = .031. A significant main effect was also found on visible-minority status in no-show rates, F (1, 901) = 6.08, p = .014.
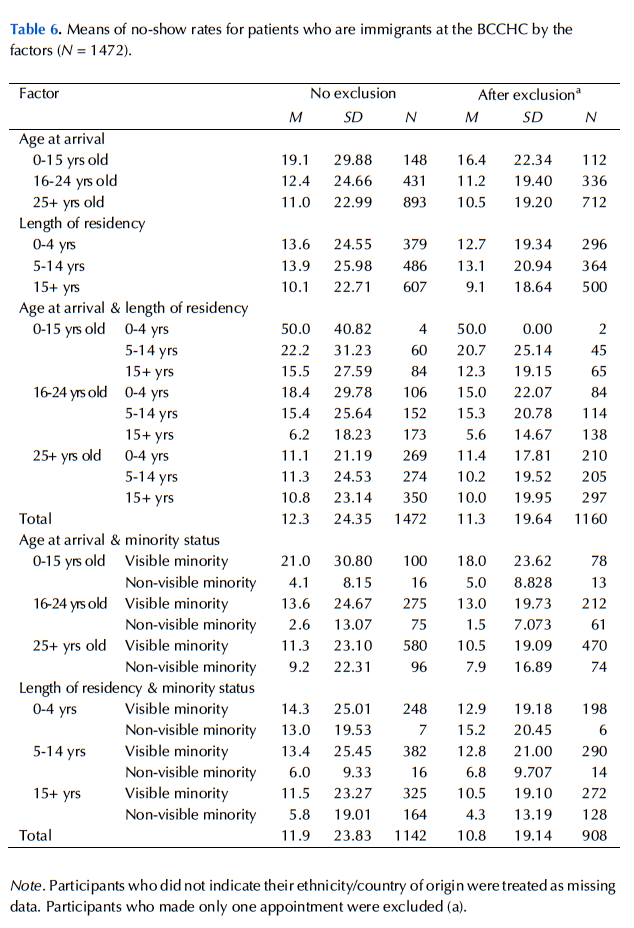
As seen in Figure 5, the visible-minority group showed a higher average no-show rate (13.41%) than did the non-visible-minority group (1.69%), but this difference was attributable to those who immigrated at age 24 or less. The no-show rates for visible-minority and for non-visible-minority immigrants arriving at age 25 or greater were virtually identical. Table 6 in Appendix B shows average no-show rates for immigrants by different factors.
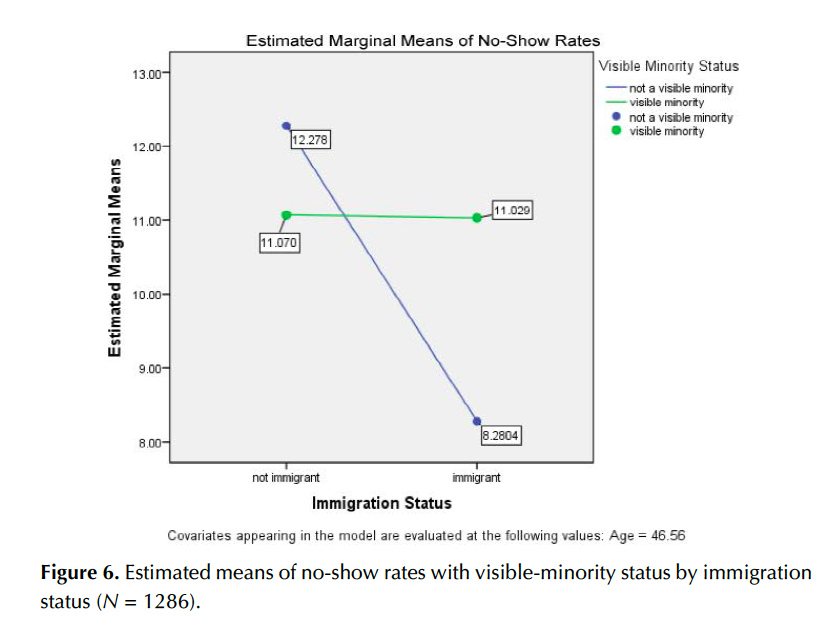
An ANCOVA was conducted to examine immigration status and visible-minority status for no-show rates; the total number of cases was 1,286 (964 visible minorities and 322 non-visible minorities; 908 immigrants and 378 non-immigrants). The ANCOVA showed that there was a marginally significant interaction between immigration status and visible-minority status, F (1, 1281) = 2.94, p = .087. There was a significant difference in the non-visible-minority group, where immigrants (M = 5.92, SD = 27.33) had a significantly lower no-show rate than those who were non-immigrants (M = 11.26, SD = 38.59), p = .045. However, as for the visible- minority group, immigration status seemed not to have an impact on no-show rates. Figure 6 shows differences in no-show rates between visible-minority and immigration status.
Significant differences in the numbers of no-shows for ethnicity, visible-minority status, and country of origin were found with the chi-square analysis. Analysis of variance (ANOVA) and analysis of covariance (ANCOVA) revealed that age and length of migration, visible-minority status, and immigration status affected no-show rates, but in complex ways. It should be noted that these factors were examined in a relational rather than a causal fashion; however, the result suggests that these factors should play an important role in further investigations to identify the reasons for no-shows.
In addition, it may be that other factors, possibly unobserved, are confounded with this study’s explanatory factors in regard to the no-show rate outcome variable. Possibilities include: socio-economic status, educational levels, working styles, living situations, and gender. These other factors should be explored in future research.
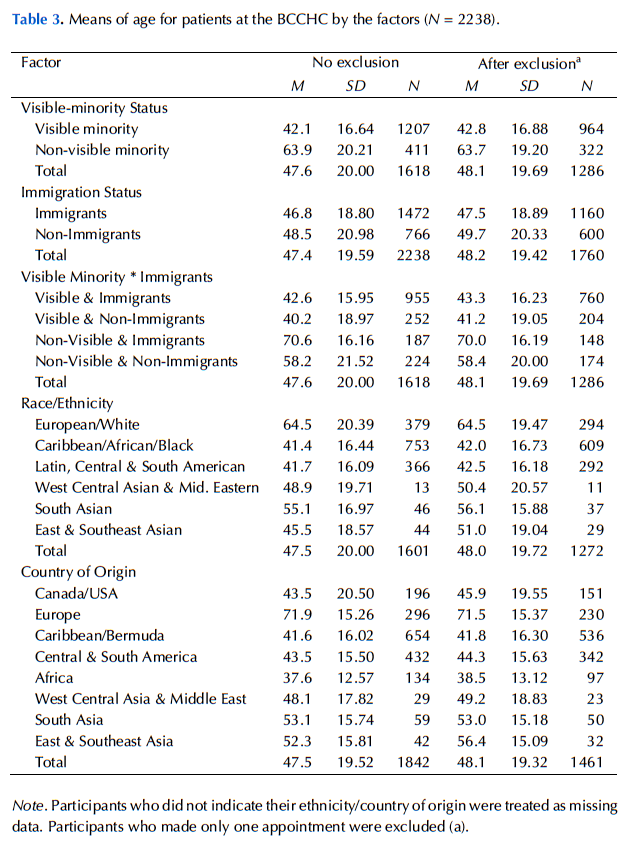
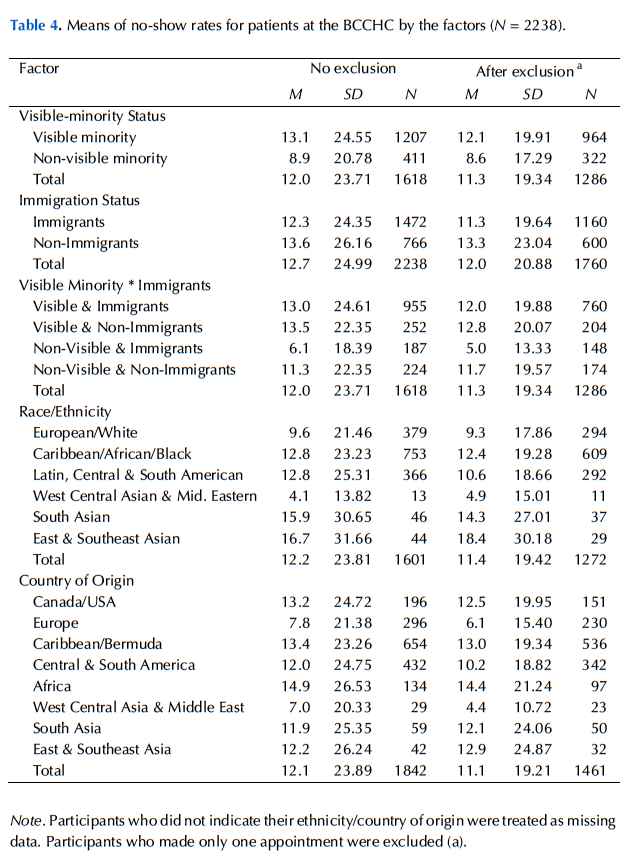
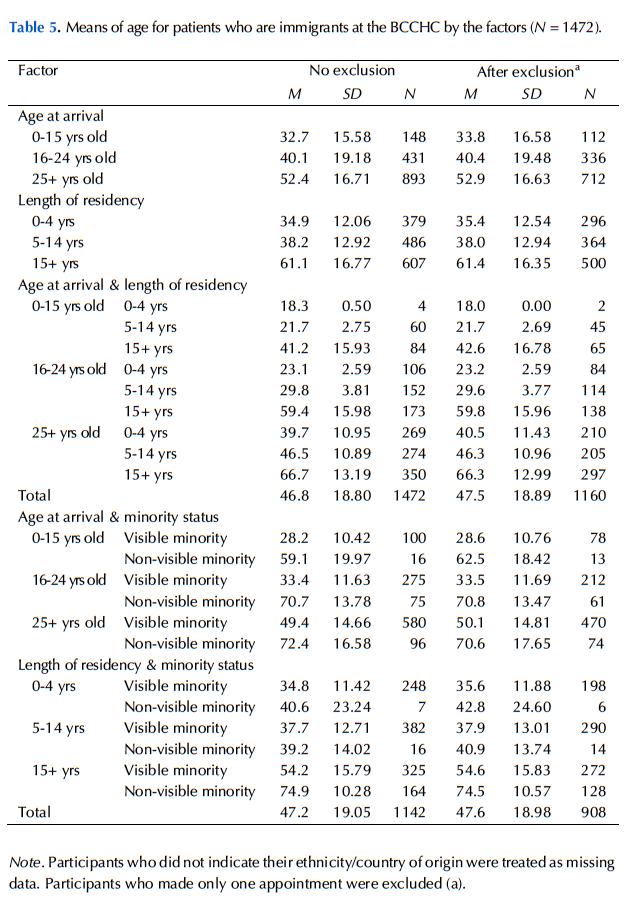
Age was one of the strong confounding explanatory factors, and it also showed a significant negative association with the no-show behaviour found in this study. Therefore, to control this extraneous variable, age was included as a covariate in the analysis of variance in the current study, except for the analysis examining age at arrival and length of residency in Canada, for the sum of these two variables is the person’s actual age. In other words, it would have been redundant to include the person’s actual age. It is recommended that future studies of no-show rates consider age as both an explanatory and confounding variable. In Appendix B, Tables 3 and 4 show mean age and mean no-show rates, respectively, for different factors; Tables 5 and 6 show mean age and mean no-show rates, respectively, for immigrants.
Visible minorities generally showed a higher no-show rate than non-visible minorities; however, when both immigrants and non-immigrants were included in the analysis, no-show rates of the patients from the non-visible-minority and non- immigrant combination had a higher no-show rate than other combinations. In contrast, immigration status did not have the same relation to no-show rates for the visible-minority group.
The chi-square test suggested that visible minorities were more likely to repeat no-shows than those who were not visible minorities; however, the study did not examine how many appointments they missed as a no-show. As mentioned above, when both immigration statuses were included in the analysis of variance, the highest no-show rate came from participants who were neither immigrants nor visible minorities. In that case, reasons for no-shows were not likely to be because they were not familiar with the appointment system in Canada. Also, not being a visible minority equates to less likelihood of facing racism or discrimination and thus trust issues might not be considered reasons for no-shows. Future study should explore this population—clients who were not visible minorities and who were born in Canada—and other possible factors that could influence their no-show behaviour.
The ultimate goal of the project is to reduce the number of no-show appointments. The analysis of the scheduled appointments showed that about one third of the participants missed some or all scheduled appointments, and these no-show appointments were about one tenth of the total appointments in this study. Also, those who made more appointments were more likely to display no-show behaviour; however, this is only an association between the number of appointments and no-shows. In addition, more than half of the “no-shows” missed only one appointment, which created 406 unattended appointment slots. The other half of the no-shows were “no-show repeaters,” which created 825 unattended appointment slots. Thus, 33.0% of the total missed appointments were one-time no-shows, and it is likely that most were due to forgetfulness. This result corresponds with the finding from the survey research in 2012 at the BCCHC by my colleagues, i.e. that the main cause of no-shows was forgetfulness (B. Choi, personal communication, April 11, 2013; C. Smirle, personal communication, April 12, 2013). Taking current and past studies into consideration, the following are recommended interventions.
Appointment reminders
One would expect that employing an appointment-reminder system might help to reduce the no-show instances that result from forgetfulness; however, despite the Centre’s having implemented such a system, no improvement has been observed (Dave & Barragan, 2012). Perhaps different types of reminders need to be implemented. Parikh et al. (2010) suggested that a reminder from staff was more effective and significantly reduced no-show rates compared to using an automated reminder system. According to Henry, Goetz, and Asch (2012), text-message reminders “may work best for patients who are homeless, have low-incomes, or are less likely to have a home-based telephone” (p. 414). Based on the data from the BCCHC, the number of newcomers in the previous five years (2008-2012) was 379, or 25.75% of the total number of immigrants and 16.93% of participants. It is possible for newcomers not to have a home-based telephone. In addition, text messaging as a tool of communication has been dramatically increasing in Canada (Canadian Wireless Telecommunications Association, 2013). As younger participants had a higher rate of no-shows, and at the same time are more likely to use cellular phones with text-messaging capabilities than older adults, it stands to reason that a text-message reminder might be more effective for clients at the BCCHC.
Open-access scheduling
When patients need to wait for many days to make an appointment, not only does it frustrate them, they are also more likely to forget the appointment. They may not even need the appointment any longer. Past studies have proven the effectiveness of introducing an open-access scheduling method to reduce no-show rates (Bundy, Randolph, Murray, Anderson, & Margolis, 2005; Kopach et al., 2007; Lacy et al., 2004). According to Kopach et al. (2007), “when participants were able to schedule an appointment for the next day, their no-show rate was decreased by 50%” (pp. 121-122). Open-access scheduling would provide available and timely appointments and could be an effective tool for reducing no-show rates.
No-show policy
The multiple no-shows also need to be prevented. These no-show repeaters created 465 unattended appointments slots, 37.7% of total no-show appointments, made by 117 participants (5.2% of the total participants). The multiple no-shows would be more likely to have different reasons from just forgetting their appointments; therefore, a different intervention should be considered.
For example, a study at a community mental health centre introduced a new no-show policy that significantly reduced its no-show rates from 21.5% to 14.6% (Van Dieren, Rijckmans, Mathijssen, Lobbestael, & Arntz, 2013). The policy included scheduling a 20-minute appointment following the first no-show and discussing the reasons for the no-show and solutions for preventing future no-shows with healthcare providers (Van Dieren et al., 2013). Initiated at the onset of no-show behaviour, the policy could prevent future no-shows. Another example of an effective no-show policy is the termination of the service as a penalty for patients’ no-shows. If they failed to attend their appointments three times in a year, they were not allowed to make their next appointment until they completed a one-hour session on improving appointment-keeping behaviour (Schmalzried & Liszak, 2012). Discussing the issue with patients would seem to be a key factor for an effective policy.
No-show behaviour continues to be a serious issue at various healthcare centres. The factors in predicting no-show behaviour found in this study provide perspectives for implementing interventions for the Centre and suggest new questions for further research. For example, future studies could investigate the reasons for the no-shows by using the survey method to find out whether the individuals’ ethnic identity is associated with trust towards society and its relationship with no-show behaviour. Future research should also explore reasons and factors of a high rate of no-shows among non-visible minorities who are non- immigrants.
Many factors are interconnected in explaining a person’s no-show behaviour. It is important to note that the reasons for no-show behaviours are likely complex and individual differences should not be underestimated.
Access Alliance (2011). Research bulletin #1. Labour market challenges and discrimination faced by racialized groups in the Black Creek area. Toronto: Access Alliance. Retrieved from http://accessalliance.ca/content/launch-working-rough-living-poor-report
Bean, A. G., & Talaga, J. (1995). Predicting appointment breaking. Journal of Health Care Marketing, 15(1), 29-34.
Bennett, K. J., & Baxley, E. G. (2009). The effect of a carve-out advanced access scheduling system on no-show rates. Family Medicine, 41(1), 51-56.
Bundy, D. G., Randolph, G. D., Murray, M., Anderson, J., Margolis, P. A. (2005). Open access in primary care: Results of a North Carolina pilot project. Pediatrics,116(1), 82-87. doi:10.1542/peds.2004-2573
Campbell, J. D., Chez, R. A., Queen, T., Barcelo, A., & Patron, E. (2000). The no-show rate in a high-risk obstetric clinic. Journal of Women's Health & Gender-Based Medicine, 9(8), 891-895. doi:10.1089/152460900750020928
Canadian Wireless Telecommunications Association. (2013). Facts & figures: The Canadian market. Retrieved from http://cwta.ca/facts-figures/
Cheung, B. Y., Chudek, M., & Heine, S. (2011). Evidence for acculturation: Younger immigrants report acculturating at a faster rate. Psychological Science, 22(2), 147-152. doi:10.1177/0956797610394661
City of Toronto. (2013a). Priority areas: Priority area profiles 2006. Retrieved from http://www.toronto.ca/demographics/priorityareas.htm
City of Toronto. (2013b). Toronto's racial diversity. Retrieved from http://www.toronto.ca /toronto_facts/diversity.htm
Dave, M., & Barragan, J. (2012). Black Creek Community Health Centre 2012 [PowerPoint slides]. Project information session presented at York University, Toronto.
Defife, J. A., Conklin, C. Z., Smith, J. M., & Poole, J. (2010). Psychotherapy appointment no-shows: Rates and reasons. Psychotherapy: Theory/Research/ Practice/Training, 47(3), 413-417. doi:10.1037/a0021168
Finkelstein, S. R., Liu, N., Jani, B., Rosenthal, D., & Poghosyan, L. (2013). Appointment reminder systems and patient preferences: Patient technology usage and familiarity with other service providers as predictive variables. Health Informatics Journal, 19(2), 79-90. doi:10.1177/1460458212458429
Fukuoka, S. (2012). No-show behaviour: Language discordance between health providers and clients: A research project at the Black Creek Community Health Centre in Toronto, Ontario (Unpublished honours undergraduate thesis). York University, Toronto.
Harris, R., Cormack, D., Tobias, M., Yeh, L. C., Talamaivao, N., Minster, J., Timutimu, R. (2012). Self-reported experience of racial discrimination and health care use in New Zealand: Results from the 2006/07 New Zealand Health Survey. American Journal of Public Health, 102(5), 1012-1019. doi:10.2105 /AJPH.2011.300626
Heim, D., Hunter, S. C., & Jones, R. (2011). Perceived discrimination, identification, social capital, and well-being: Relationships with physical health and psychological distress in a U. K. minority ethnic community sample. Journal of Cross-Cultural Psychology, 42(7), 1145-1164. doi:10.1177/0022022110383310
Henry, S. R., Goetz, M. B., & Asch, S. M. (2012). The effect of automated telephone appointment reminders on HIV primary care no-shows by veterans. Journal of the Association of Nurses in AIDS Care, 23(5), 409-418. doi:10.1016 /j.jana.2011.11.001
Kopach, R., Delaurentis, P. C., Lawley, M., Muthuraman, K., Ozsen, L., Rardin, R., . . . Wills, D. (2007). Effects of clinical characteristics on successful open access scheduling. Health Care Management Science, 10(2), 111-124. doi:10.1007 /s10729-007-9008-9
Lacy, N. L., Paulman, A., Reuter, M. D., & Lovejoy, B. (2004). Why we don't come: Patient perceptions on no-shows. Annals of Family Medicine, 2(6), 541-545. doi:10.1370/afm.123
Martin, B. C., Shi, L., & Ward, R. D. (2009). Race, gender, and language concordance in the primary care setting. International Journal of Health Care Quality Assurance, 22(4), 340- 352. doi:10.1108/09526860910964816
Maxwell, S., Maljanian, R., Horowitz, S., Pianka, M. A., Cabrera, Y., & Greene, J. (2001). Effectiveness of reminder systems on appointment adherence rates. Journal of Health Care for the Poor and Underserved, 12(4), 504-514. doi: 10.1353/hpu.2010.0766
Mitchell, A. J., & Selmes, T. (2007). Why don't patients attend their appointments? Maintaining engagement with psychiatric services. Advances in Psychiatric Treatment, 13(6), 423-434. doi:10.1192/apt.bp.106.003202
Parikh, A., Gupta, K., Wilson, A. C., Fields, K., Cosgrove, N. M., & Kostis, J. B. (2010). The effectiveness of outpatient appointment reminder systems in reducing no-show rates. The American Journal of Medicine, 123(6), 542-548. doi:10.1016 /j.amjmed.2009.11.022
Paterson, B., Charlton, P., & Richard, S. (2010). Nonattendance in chronic disease clinic: A matter of non-compliance? Journal of Nursing and Healthcare of Chronic Illness, 2(1), 63-74. doi:10.1111/j.1752-9824.2010.01048.x
Paul, J., & Hanna, J. B. (1997). Applying the marketing concept in health care: The no-show problem. Health Marketing Quarterly, 14(3), 3-17. doi:10.1300/J026v14n03_02
Peeters, F. P. M. L., & Bayer, H. (1999). "No-show" for initial screening at a community mental health centre: Reasons and further help-seeking. Social Psychiatry and Psychiatric Epidemiology, 34(6), 323-327. doi:10.1007/s001270050151
Satiani, B., Miller, S., & Patel, D. (2009). No-show rates in the vascular laboratory: Analysis and possible solutions. Journal of Vascular and Interventional Radiology, 20(1), 87-91. doi:10.1016/j.jvir.2008.09.027
Schmalzried, H. D., & Liszak, J. (2012). A model program to reduce patient failure to keep scheduled medical appointments. Journal of Community Health, 37(3), 715-718. doi:10.1007/s10900-011-9505-0
Statistics Canada. (2012). Classification of visible minority. Retrieved from http://www.statcan.gc.ca/concepts/definitions/minority01-minorite01a-eng.htm
Statistics Canada. (2013). Immigration and ethnocultural diversity. In 2011 National household survey: Data tables, (Catalog number 99-010-x2011026, 99-010-x2011028, 99-010-x2011029). Retrieved from http://www12.statcan.gc.ca/nhs-enm/2011/dp-pd/dt-td/Lp-eng.cfm?LANG=E&APATH=3&DETAIL=0&DIM=0&FL=A&FREE=0&GC=0&GID=0&GK=0&GRP=0&PID=0&PRID=0&PTYPE=105277&S=0&SHOWALL=0&SUB=0&Temporal=2013&THEME=95&VID=0&VNAMEE=&VNAMEF=
Uslaner, E. M. (2012). Segregation and mistrust: Diversity, isolation, and social cohesion. New York: Cambridge University Press.
Van Dieren, Q., Rijckmans, M. J. N., Mathijssen, J. J. P., Lobbestael, J., & Arntz, A. R. (2013). Reducing no-show behavior at a community mental health center. Journal of Community Psychology, 41(7), 844-850. doi:10.1002/jcop.21577
Wilson, R. M., Landolt, P., Shakya, Y. B., Galabuzi, G., Zahoorunissa, Z., Pham, D., . . . Joly, M-P. (2011). Working rough, living poor: Employment and income insecurities faced by racialized groups in the Black Creek area and their impacts on health. Toronto: Access Alliance Multicultural Health and Community Services.
Wu, Z., Hou, F., & Schimmele, C. M. (2011). Racial diversity and sense of belonging in urban neighborhoods. City & Community, 10(4), 373-392. doi:10.1111/j.1540 -6040.2011.01374.x